Election maps and the case of the missing votes
Advertisement
Read this article for free:
or
Already have an account? Log in here »
We need your support!
Local journalism needs your support!
As we navigate through unprecedented times, our journalists are working harder than ever to bring you the latest local updates to keep you safe and informed.
Now, more than ever, we need your support.
Starting at $15.99 plus taxes every four weeks you can access your Brandon Sun online and full access to all content as it appears on our website.
Subscribe Nowor call circulation directly at (204) 727-0527.
Your pledge helps to ensure we provide the news that matters most to your community!
To continue reading, please subscribe:
Add Brandon Sun access to your Free Press subscription for only an additional
$1 for the first 4 weeks*
*Your next subscription payment will increase by $1.00 and you will be charged $20.00 plus GST for four weeks. After four weeks, your payment will increase to $24.00 plus GST every four weeks.
Read unlimited articles for free today:
or
Already have an account? Log in here »
Hey there, time traveller!
This article was published 01/11/2010 (5623 days ago), so information in it may no longer be current.
On Friday, I spent some time going over numbers from the 2006 mayoral election. Initially, I was intrigued by Shari Decter Hirst’s 1,500-vote margin of victory this year and wanted to see where she was strongest, and where incumbent Dave Burgess had managed to fend her off.
But, since a ward-by-ward breakdown of 2010 hadn’t been completed yet (Senior Election Official Heather Ewasiuk was working on it, and got the numbers to me right after lunch) I looked at the numbers from four years ago first.
They’re available, along with a wealth of other election information, on the BrandonVotes.ca site.
The numbers show that Burgess basically had a cakewalk in 2006. Despite being faced with a trio of big-name candidates in Mike Abbey, Deveryn Ross and Beth Smale, Burgess was never seriously challenged. And it’s not like they split the vote, allowing him to sneak through. Voters decisively returned Burgess to office in 2006 with 2,500 votes more than all of his rivals combined.
Given that depth of support, I expected the 2010 matchup to be much closer than it was.
Even knowing that Decter Hirst had won the election, I expected that Burgess had done well in some parts of the city and that she had simply done better, in other parts.
But when the 2010 numbers were complete, and I looked at the breakdown of ward results and polling stations, I was astonished to find that Burgess hadn’t won a single ward this year.
Compare that to last election, when he won every single ward in the city.
However, digging deeper, I found some interesting nuggets buried in the numbers, and I started putting together some maps to visualize it. Enlarge them, above, to follow along.
I wrote a brief story analyzing the two maps, which you can read here.
I was inspired, in part, by two recent posts by Brian F. Kelcey at stateofthecity.ca. He pointed to a BBC map from the recent London mayoral election and to a Torontoist map from the recent Toronto mayoral election to show how urban areas were starting to elect mayors based primarily on voter support from the suburbs.
(Update: He’s got a third post up looking at Winnipeg, which references a Winnipeg Free Press map, as well.)
The story appears to be the reverse this election in Brandon.
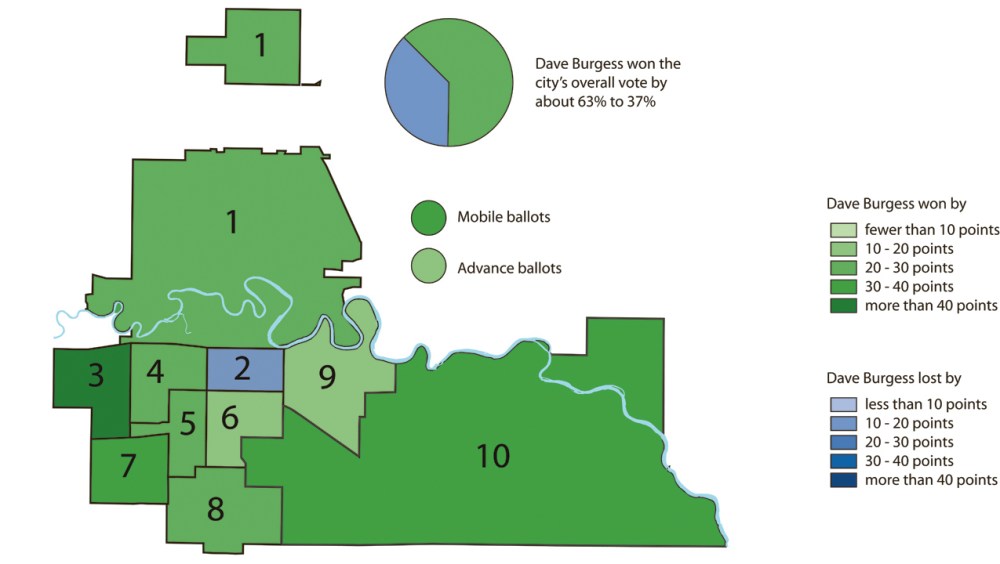
If you look at the (mostly green) map from the 2006 Brandon election, you’ll see that Burgess’ strengths are concentrated in the suburban west end of Brandon, although, as I said, he won everywhere.
That blue rectangle is downtown Rosser Ward, where the three main challengers denied Burgess an overall majority of the votes. He still won the ward in ’06, but with only 43 per cent of the vote (as opposed to, say, 71 per cent, like in west-end Victoria Ward).
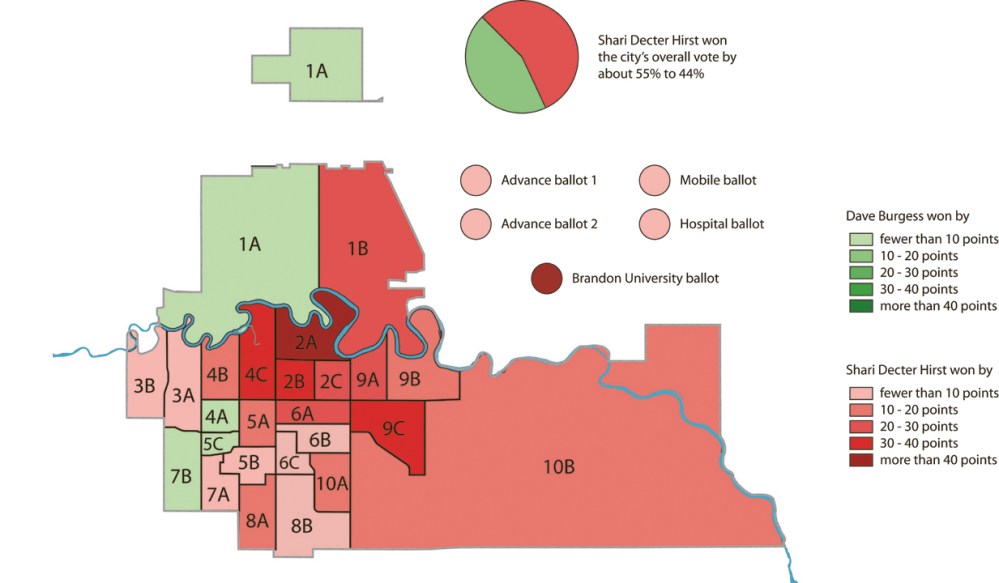
Then, if you look at the (mostly red) map from the 2010 Brandon election, you’ll see that Decter Hirst’s strengths are concentrated in the core areas — including the downtown Rosser Ward and east-end Riverview Ward. She also did extremely well in the University area.
In short, she was strongest in precisely the urban areas where Burgess had been proved weakest four years ago.
Stunningly, though, even where he was strong, she was mostly stronger. Burgess only managed to out-poll Decter Hirst in four of the 30 polling stations.
(He did almost win the Linden Lanes ward — he beat her by 22 votes in 7B, but lost to her by 25 votes in 7A, leaving a total margin in favour of Decter Hirst of only three votes.)
There are some other interesting results that you can tease out from the numbers (download the sub-poll results here, if you’re so inclined):
- First is that we can probably discard the "students don’t vote" canard. I’m convinced that Burgess’ skipping of the BU candidates’ forum hurt him badly — city business or no, people expected him to be there. Voters at the new polling station set up at the university voted 3-1 in favour of Decter Hirst (her largest advantage), and more of them voted at that station than five other "regular" polling places, so it was well attended. (It also got more voters than the mobile and hospital polling stations combined.)
- Secondly, although Decter Hirst was strongest in the core, and Burgess was strongest in the west end, there was broad support throughout the city for both candidates. Although Burgess was trounced at a couple of polling stations, at far more of them, he was simply beaten by a few dozen votes. Add these up over 30 polling stations, and it doesn’t take much to get a 1,500 votes. There is some evidence of an urban/suburban divide, but it’s not really that pronounced.
- Thirdly, there were 10 polling stations where the margin of victory was 12 votes or less. In broad swaths of the city, that reveals a deeply divided electorate. For all the sweeping rhetoric of a sea change in the city, voters in Victoria, Meadows and Linden Lanes wards didn’t exactly deliver Decter Hirst much of a mandate.
- Finally, if you look at the advance polls, Decter Hirst’s support was 50 per cent over Burgess’ 47 per cent — much closer than her 55 per cent to 43 per cent final tally. That suggests a surge over the final week of the election, which is precisely when Burgess was campaigning the most. Was that too little too late? Or had Decter Hirst reached a tipping point? Interesting to discuss.
(Aside: The 2006 data shows the advance polls giving Burgess a 60 per cent share of the votes, over a combined total of 40 per cent for his rivals. That rose to 63-37 on election day.)
An ordinary campaign for mayor might have looked at the data from 2006 and figured Burgess for unbeatable. He certainly appeared formidable.
But an ambitious campaign might have looked deep into the data — particularly at how Burgess was denied an outright win in downtown Brandon, and thought that there was something to exploit there.
I’d be curious to know about the strategic planning that underpinned the Decter Hirst campaign (how about it, Ms. Mayor — care to dish?) and how much the 2006 results played into it.
———-

On a side note, I found a weird discrepancy when I was examining the data from 2006.
In the official, certified results, Mike Abbey is credited with 1,553 votes. That placed him second. But when I added up the results from each of the individual wards, I was only able to get a total of 1,540 votes.
I’ve checked, double- triple- and quadruple-checked the numbers, adding them up with a pocket calculator, in a spreadsheet and with pen and paper. Abbey’s official 2006 results include a mysterious 13 votes that can’t be found anywhere.
I called Heather Ewasiuk. She wasn’t the Senior Elections Official in 2006, but said she would look into it. The mystery votes don’t appear to be from mobile or advance voting (those are included). And there shouldn’t be a missing column in the spreadsheet, since Burgess’ numbers add up correctly.
So do most of the other candidates’ — but Nickolas Avlonitis’ 2006 campaign was credited with 107 votes, when I can only add his numbers up to 106.
But it’s the Abbey results that perplex. Thirteen votes wouldn’t be enough to shift the election — and what could you do about it four years later, anyway? — but it’s weird that no one noticed at the time, and it’s weird that it happened in the first place.
Any theories? Download the official spreadsheet here, and check it yourself, if you’d like.
For the record, the numbers all appear to add up this year.